In our previous post, we rounded up existing infographics about artist books and encouraged our readers to plot them on a Venn diagram of our own. Then we each did this exercise as a way to get our collaborative conversation going. Things are slippery in the book arts world, hence the many versions of diagrams attempting to wrangle these objects and publications. We decided to lean into these different versions of categorization and post two versions, with a bit of justification.
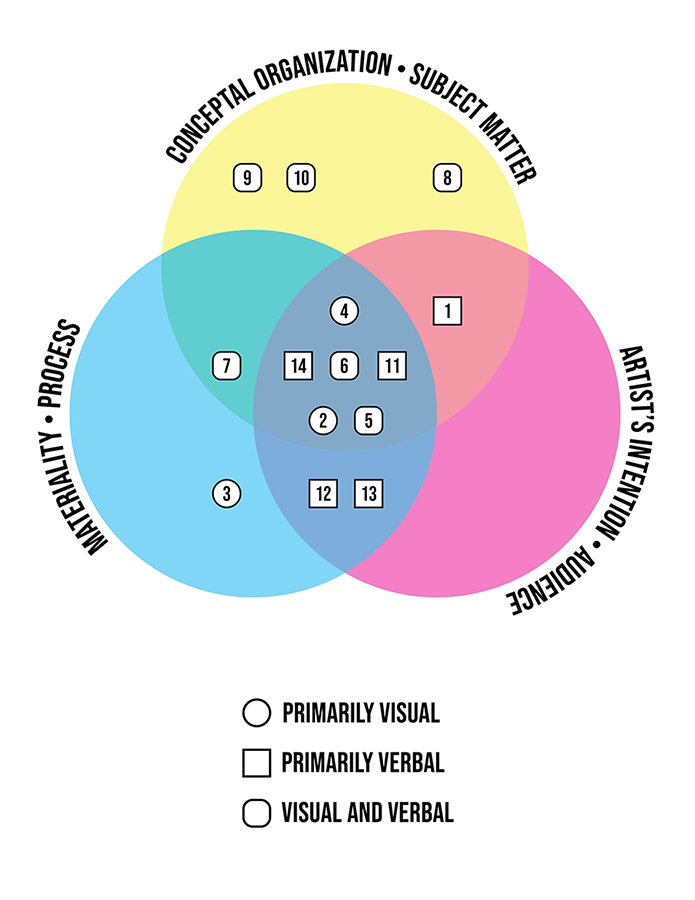
Levi Sherman’s proposed categorization of artist book infographics.
Only one section of our Venn diagram remained unpopulated: infographics that deal exclusively with artist intent or audience. The book arts field seems to emphasize books rather than the people who make them or read them. This is notable since related fields had turned their attention to social, political and economic relations around the time many of these infographics were made. The best-known example may be book historian Robert Darnton’s 1982 “Communications Circuit,” which tries to account for the creation, reception, and survival of a book through all the humans that interact with it, and through the book with one another.
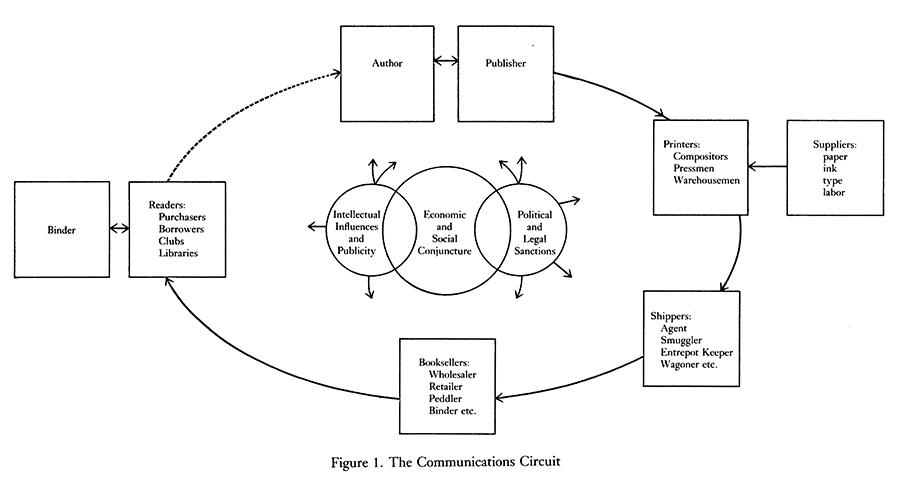
Darnton, Robert. “What Is the History of Books?” Daedalus 111, no. 3 (1982): 65–83, figure 1.
Hiding beneath a misleading title, we did find one infographic that takes a similar approach: Kione Kochi’s “Clive Phillpot's diagram updated to illustrate new complexities in the age of digital publishing.” At first blush, Kochi’s corrective seems to be technological and thus a matter of materials and processes (a trail of ants march away from Phillpot’s fruit, each carrying a digital publishing technology). However, Kochi’s real innovation is populating Phillpot’s diagram with people and institutions (dealers, collectors, distributors, commercial galleries, chain bookstores, gatekeepers, museums, book art organizations, and artist publishers). Inasmuch as Kochi’s infographic deals with digital publishing, it is about changing relations among players in the field rather than the evolution of the book object itself.
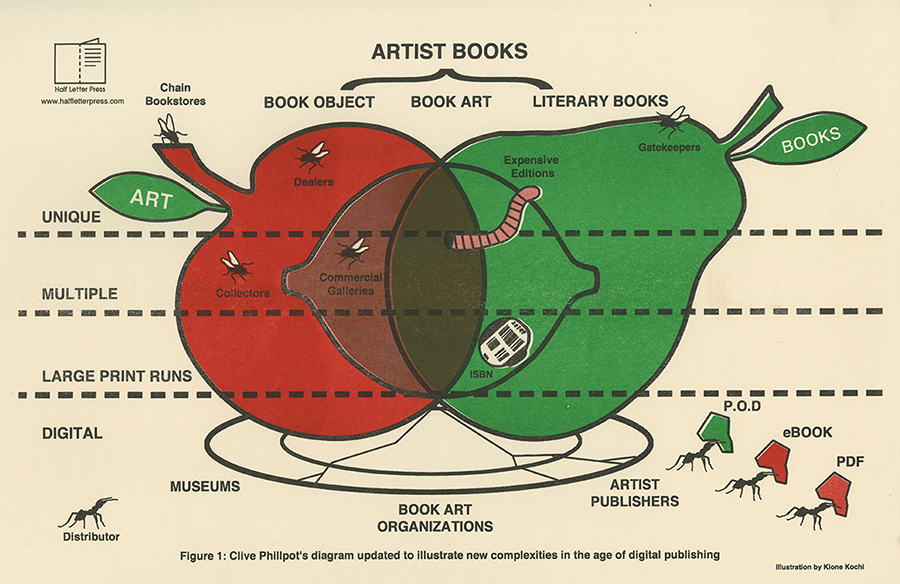
Kochi, Kione, “Clive Phillpot's diagram updated to illustrate new complexities in the age of digital publishing,” Temporary Services / Half Letter Press, 2015.
Kochi’s intervention demonstrates the influence Phillpot’s fruit diagram has had on the field, so we were interested to see its evolution over time. One version differs from the fruit diagram only in the phrasing of “literary books” as “just books” and the use of simple geometric shapes instead of fruit. Did the fruit diagram dominate the discourse simply because it is more fun, or is there an important observation that, while art and books exert equal force on artist books, they are fundamentally different from one another (apple and pear rather than circle and circle)?
Likewise, the fruit diagram organizes books into unique and multiple, whereas another version groups them by visual, verbal, and verbi-visual. Does the preference for the former reflect (or create) a field more interested in materials and process than conceptual organization and subject matter? Perhaps the utility of Phillpot’s fruit diagram is its ability to define or describe the field for outsiders, while other infographics we found do more for those already inside the field. Kochi’s ironic update is certainly meant for insiders, and so is Daniel Mellis’ “Handmade-o-Meter,” which was published in the Journal of Artists’ Books. By contrast, Ulises Carrión’s interdisciplinary media theory and Philip Zimmermann’s analysis of photobooks bring readers in from other fields.
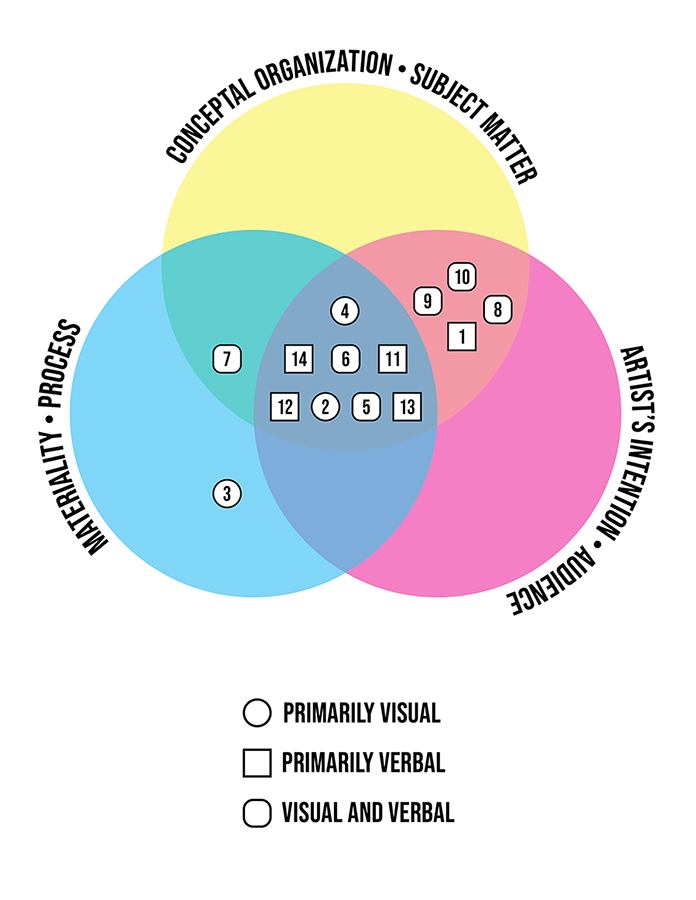
AB Gorham’s proposed categorization of artist book infographics.
One could argue Manuel Portela’s diagrams capture the artist’s intent, although originally we hadn’t put them into that category. Portela is attempting to visualize the conceptual and textual strategies of the Danielewski text in a way that feels like a “close reading” but with visual workflow.
Throughout our exercise, we thought of the infographics as either primarily verbal or primarily visual, but then decided to demarcate those infographics that make use of text and visuals equally. For example, there is a clear distinction between Philip Zimmermann’s photo-bookwork chart (which is essentially a list) and most of the other infographics, but some of the Phillpot diagrams are combinations of simple geometric shapes and concise wording. This may seem less important than the subjects of the areas of the Venn diagram, but it is certainly a part of the argument and perhaps reveals something about how the design of infographics affects the field.
As mentioned above, Kione’s introduction of “digital publishing” to update the classic Phillpot infographic could itself probably use an update to address the myriad ways that digital media is being incorporated into the artist book world. It would be interesting to see how means of digital publication could become a set of categories for classifying artist books. What would these categories look like? What about books with apps, books with video components, books with digital soundtracks or video games connected to them?
Ultimately, this structural exercise isn’t about finding the correct answer to our Venn diagram question. It’s about using the data collection of existing book arts (and book-adjacent) infographics and diagrams to get an understanding of the ways in which artists and theorists are thinking about book arts and publication. In this way, these diagrams are as much about the present state of the book and publication arts world as they are about the future — let’s focus on the gaps.
Levi Sherman is a PhD student in Art History at the University of Wisconsin–Madison, and the founder of Artists’ Book Reviews.
AB Gorham is a book artist and writer from Montana. She is the Director of Black Rock Press where she teaches book arts in the Book and Publication Arts Program. Her artist books have been exhibited and collected nationally.